Comparative study of the width/thickness ratio of a foil surf board
This example is a response to a shaper’s question: The shaper would first like to define the ideal ratio of a foil surfboard, and understand what changes if the board floats or sinks when stationary, depending on the weight of the surfer. To address the question of buoyancy at the At the stop we are going to test 2 surfers weighing 80 kg and 120 kg. The 80 kg surfer will always be carried by the flotation, while the 120 kg surfer will sink when starting. In this example we see a hydrodynamic drag analysis of a board without foil, which we will then equip with a foil. We will also see the importance of setting the foil.
We are going to model 3 boards of length 1829 (6') and volume 115 liters by varying the width/thickness ratio. We will use a base board whose size, width and thickness we will adapt using the “size config” tool in the SWD software to create 3 width/thickness ratio configurations: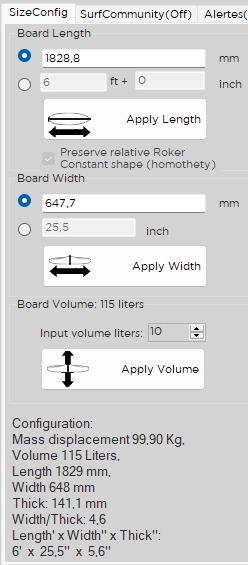
ratio=4.6: 1829mm x648x141 (6' x 25,5" x 5.6").

2. ratio =2.9: 1829mm x518x176(6' x 20,4" x 6.9":

3. ratio =2 : 1829mm x408x212 (6' x 17" x 8.3") :

SWD users will find the modeling of these examples on:
- surfhydrodynamics.com/hydrodynamics_surf_exemples/test_foil_boards_115_l_ratio_4_6.fynbs
- surfhydrodynamics.com/hydrodynamics_surf_exemples/test_foil_boards_115_l_ratio_2.9.fynbs
- surfhydrodynamics.com/hydrodynamics_surf_exemples/test_foil_boards_115_l_ratio_2.9.fynbs
Declaring a width/thickness ratio as ideal implies a viewing angle. We will observe this ratio with regard to hydrodynamic efficiency, the “stability” aspect is another angle of view that should not be neglected:
Hydrodynamic efficiency: Knowing that the propulsive energy to be provided depends on the hydrodynamic drag of the board, we will estimate that the best shape will be the one which produces the minimum drag in the range of speeds of use. By editing a drag force curve from 0 to 20 km/h we will observe the evolution of the force to be produced to propel the board. This force will be produced indifferently by the surfer while rowing, the slope of the wave, a sail, a motor, or a combination of these means whose origin does not matter. The drag force should just be as low as possible to limit the energy required.
Let's discover an example of a drag curve generated by SWD:
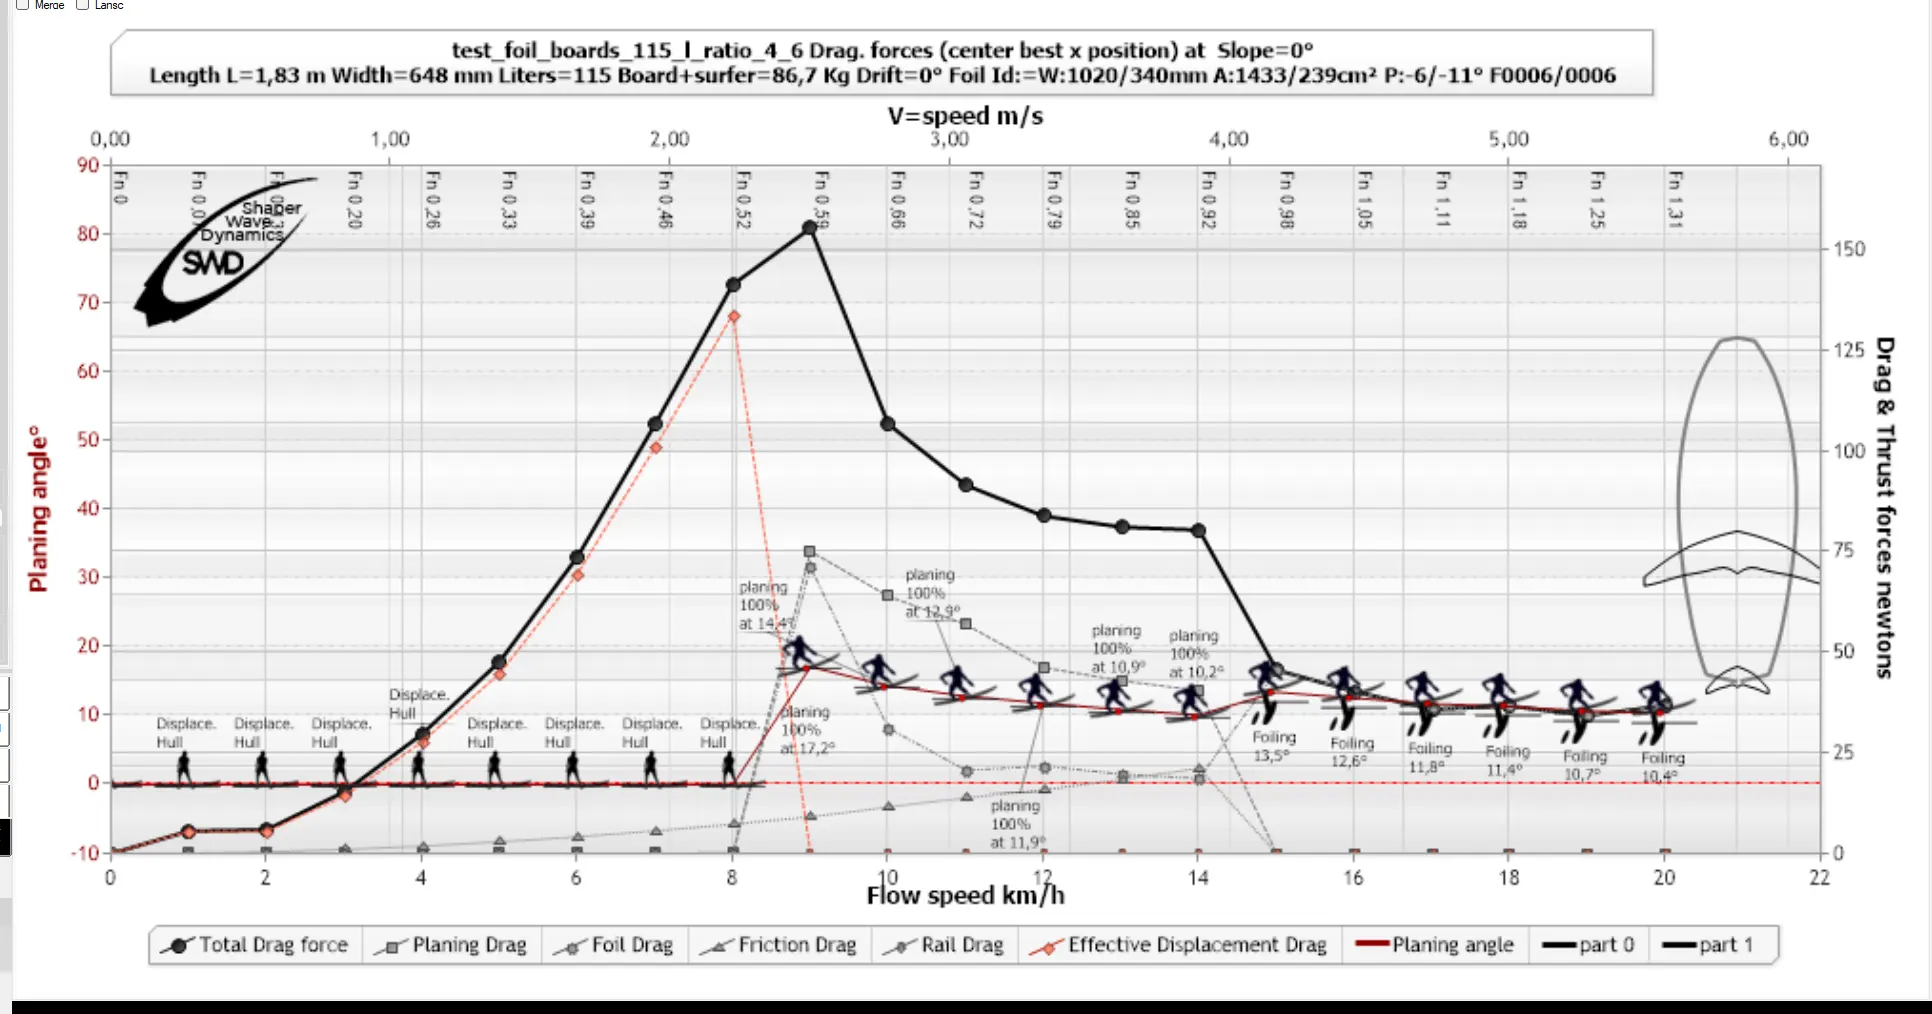 The horizontal axis shows the speed range (0 to 20 km/h), The right vertical axis indicates the drag scale in Newtons corresponding to the points on the black curve, and the left vertical axis indicates in red, the angle of incidence scale. The angle of incidence is the angle between the bottom of the board (at the wide point) and the surface of the water. The evolution of this incidence is given by the red curve, dotted with silhouettes. These silhouettes indicate the rate: hydrostatique (depalcement hull)
 Planing:
 ou Foiling:
![]()
Let’s dig deeper into this example graph showing the evolution of board character at various speeds :
- From 0 to 8 km/h the surfer silhouette is in “Hull displacment” this indicates that the board floats, like a boat, and that the dominant lift force is that of Archimedes, it is the hydrostatic lift described above . In this range we see the drag force changing with the square of the speed. This drag force is mainly composed of the displacement drag detailed by the orange curve with square points "effective displacement Drag". We note that the drag reaches around 140 newtons at the end of the "displacement Hull" phase.
- From 9 to 14 km/h the surfer goes into planing, this means that the +foil planning force is sufficient to lift the submerged volume and slide on the surface of the board bottom, as described above in the planing forces. The orange displacement drag curve goes down to zero. The overall drag force is now made up of foil drag, friction and planing drag, which peaks at 155 newtons at 9 km/h and decreases to 80 newtons at 14 km/h. The frictional drag increases but the overall drag decreases despite the increase in speed. This drop in drag comes from the reduction in the angle of incidence allowed by the increase in speed. The angle of attack increases from 17.2° to 10.2° in this speed range, and the planing drag component decreases accordingly.
- From 15 to 20 km/h, the surfer switches to foiling, only the foil drag component remains which becomes less than 40 newtons..
In this previous graph, the hydrostatic forces, the planning forces and the forces generated by the foil combine. But to show the case of a classic surfboard: we will deactivate the foil action (in the Fins/Foil Tools tab)
 and restart Editing the graph. We now see the drag curve without the action of the foil:
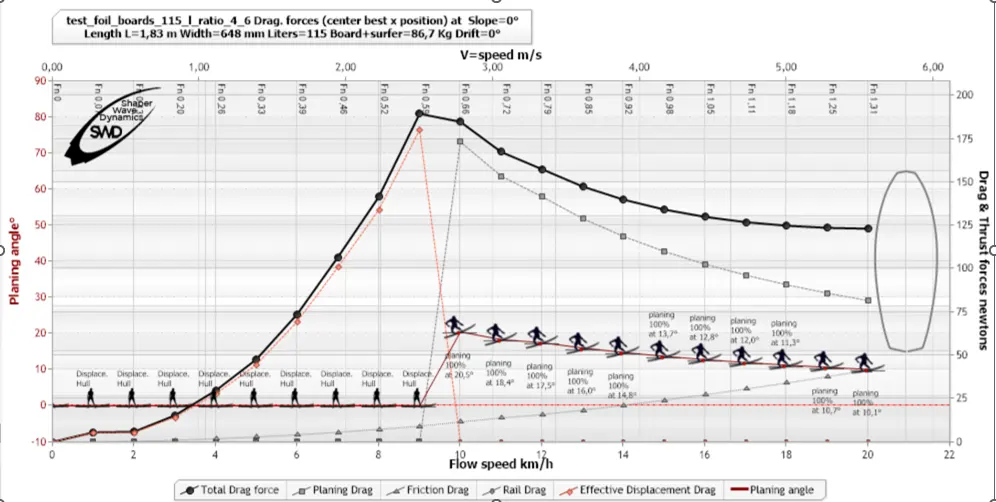
Without foil, planing occurs at 10 km/h, the planing angle changes from 20.5° to 10.1° at 20 km/h The overall drag does not drop below 125 Newtons, it is triple the configuration with foil…
Now that we know how to interpret the drag curve, let's analyze the 3 ratios to evaluate, firstly deactivating the action of the foil::
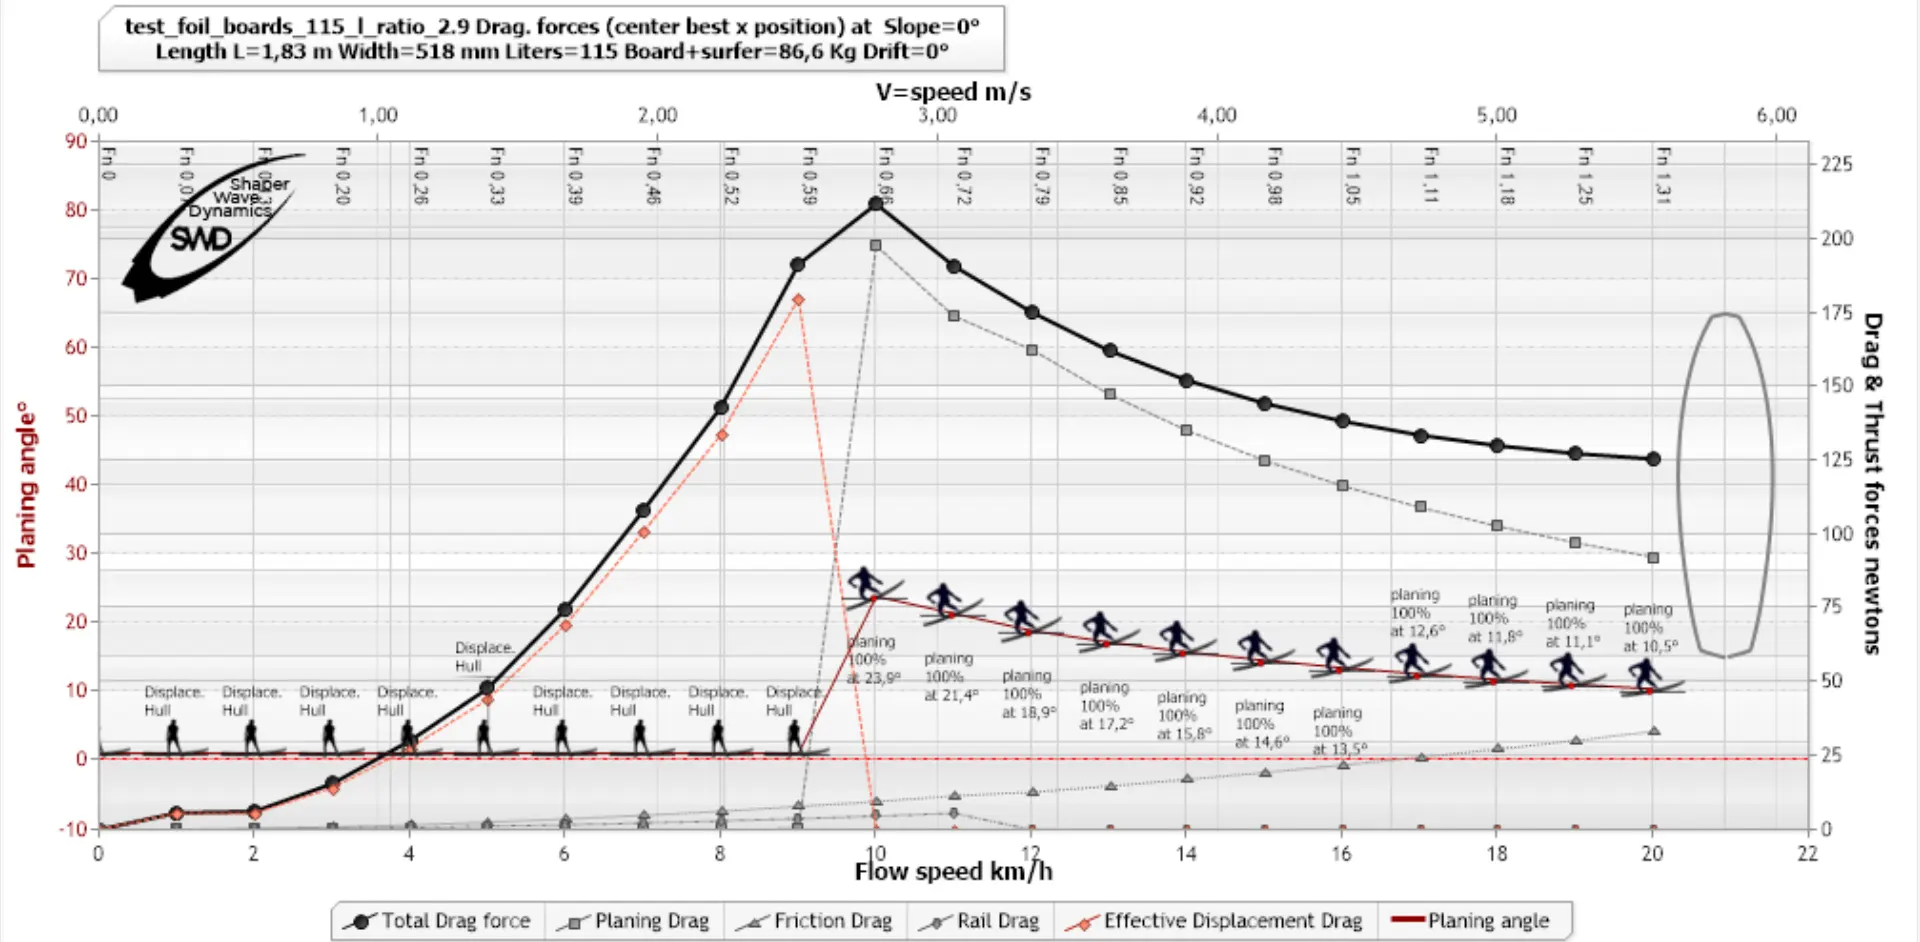
Comparison and interpretations of the evolution of drag for the 3 width/thickness ratios :
For the 3 ratios, the travel drag (orange diamond points) constitutes most of the overall drag at the start of the speed range. The movement drag depends mainly on the submerged volume, imposed by the weight of the surfer which is identical for the 3 ratios, this movement drag therefore increases with the square of the speed in an identical manner for the 3 ratios. What changes is the peak of drag when the board can go into planing and get rid of the drag of movement:
- at ratio 4.6 planing is effective at 10 km/h, the peak drag is 185 newtons, at 9 km/h and depends on the movement drag
- at ratio 2.9 planing is effective at 10 km/h, but the peak drag is 260 newtons at 10 km/h and depends on the planing drag which is due to a high planing angle of 23.9°
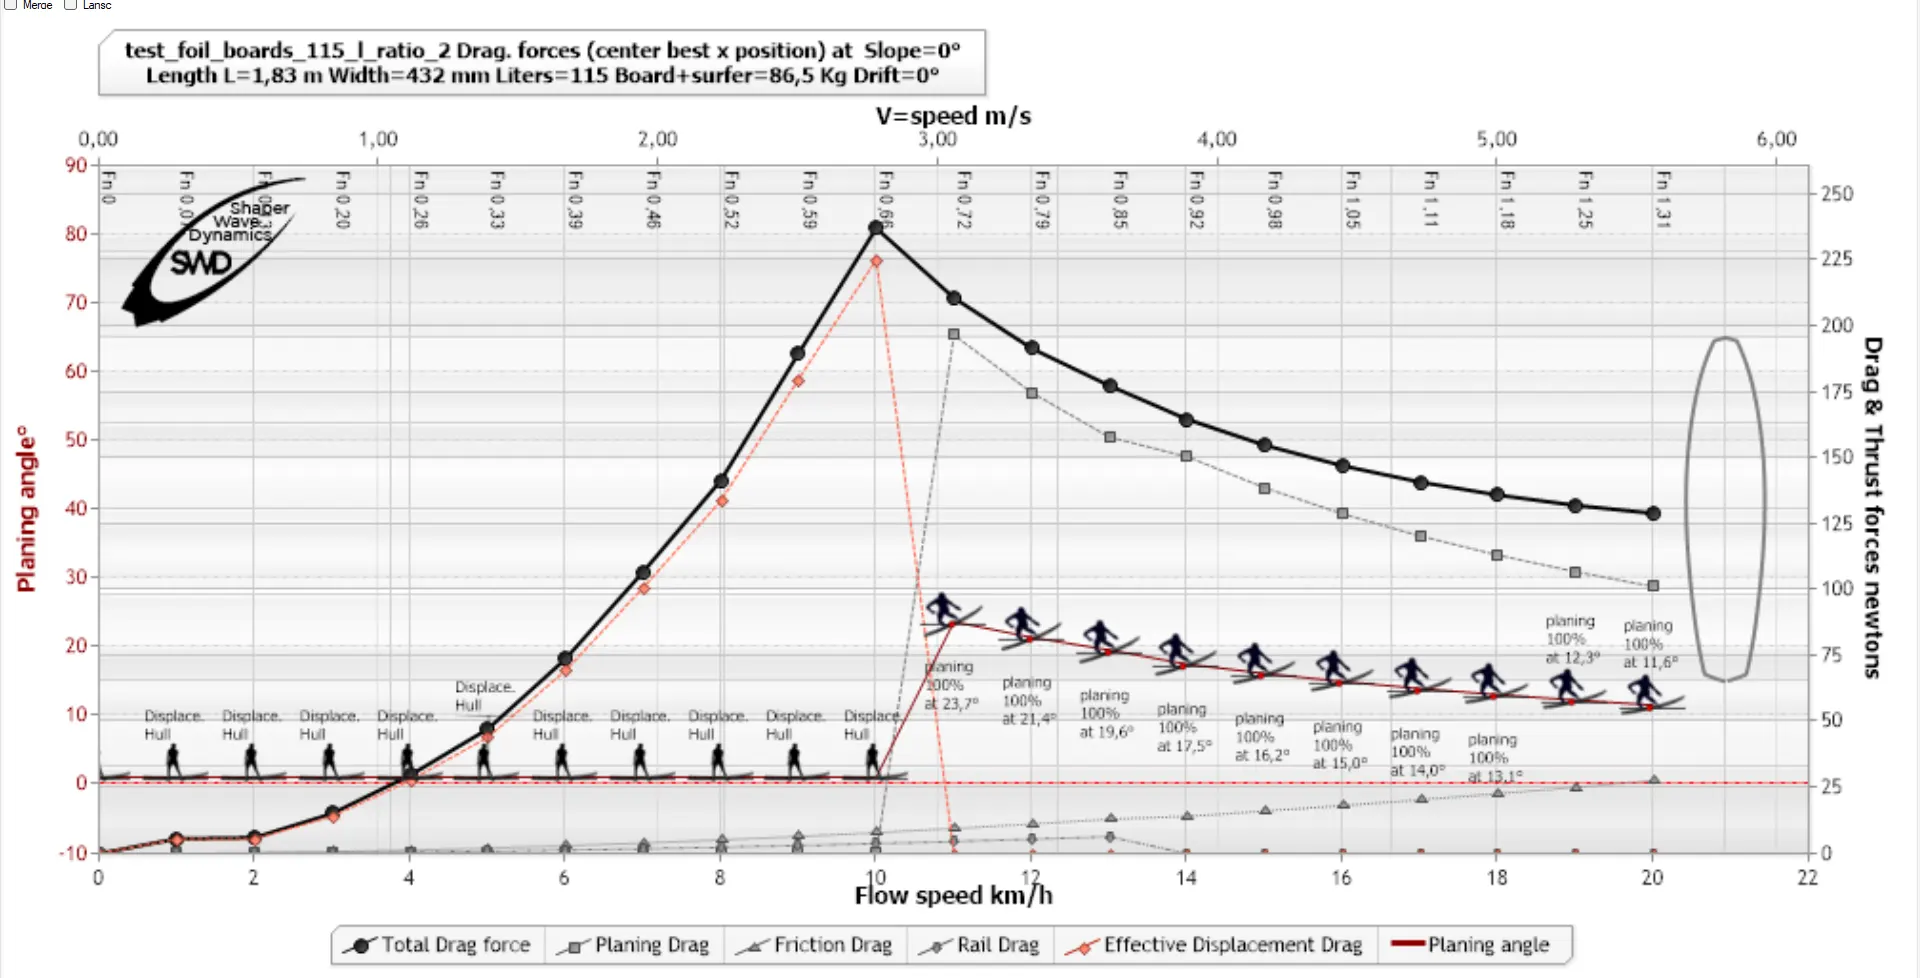
- at ratio 2 planing is effective at 11 km/h, the peak drag is around 240 newtons..
The width/thickness ratio 4.6 generates a lower peak of drag than the other ratios. This is mainly due to the length/width ratio which affects the quality of planing, for an identical speed, the ratio 4.6 generates sufficient lift at 20.5° then that 23.8° is needed at ratio 2.9. This angle difference generates greater planing drag for the 2.9 ratio. we find the observation resulting from the studies and experiments of planing hulls by Lindsay Lord and cited above. Let's continue our observation in the planing range, the overall drag is mainly composed of planing drag and friction drag (the description of these components is above in the hydrodynamic chapter) the overall drag of the planing range is lower for the 4.6 ratio as for the other ratios, we still find the consequences of the length/width ratio studied by Lindsay Lord. We note that friction drag is the only component that decreases with decreasing ratio, but that all the data points to ratio 4.6 as the best, hydrodynamically speaking.
We will summarize by arguing that it is not the ratio. width/thickness which plays a determining role but the length/width ratio. The thickness will therefore only be a factor of buoyancy depending on the weight of the surfer, but when it comes to the choice of shapes the shaper will benefit from analyzing the length/width ratio to determine the best shapes.
- The weight of the surfer was 80 kg in the previous graphs, to answer the second part of the question on the influence of the buoyancy or non-buoyancy of the board, we will rerun the previous analysis, at the 3 ratios, with a weight of 120 kg surfer who will therefore sink the 115 liter board :
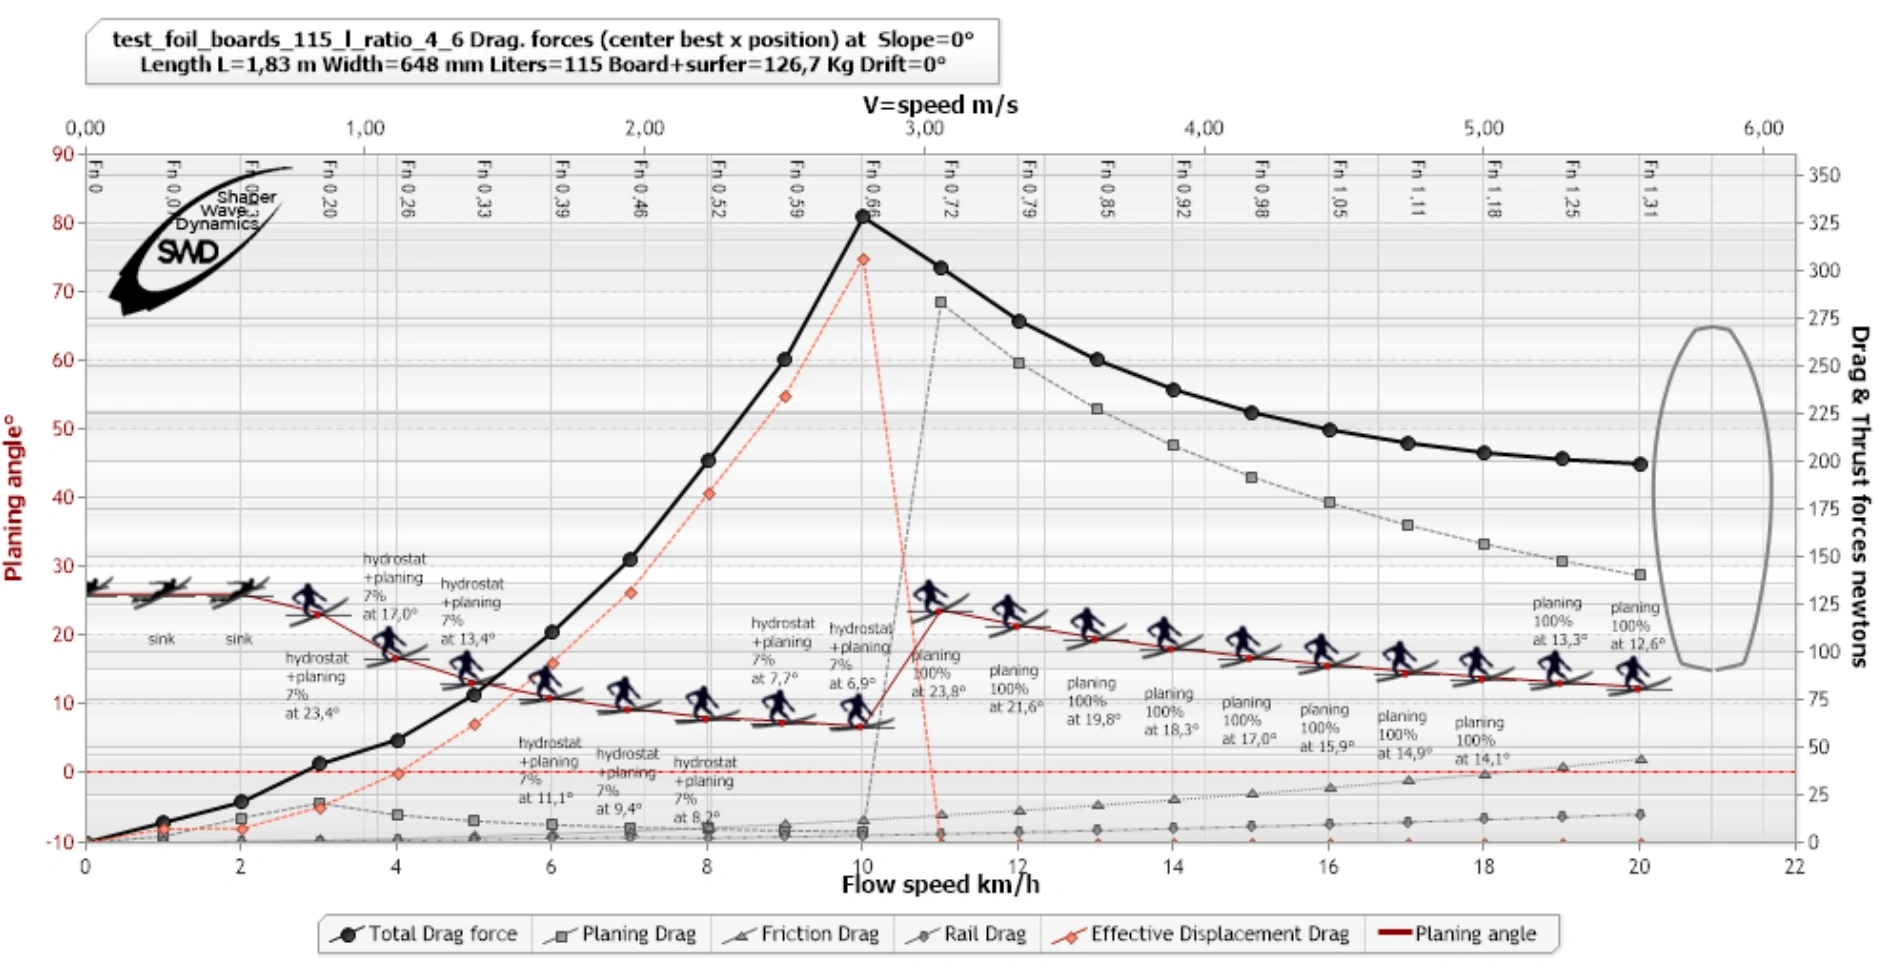
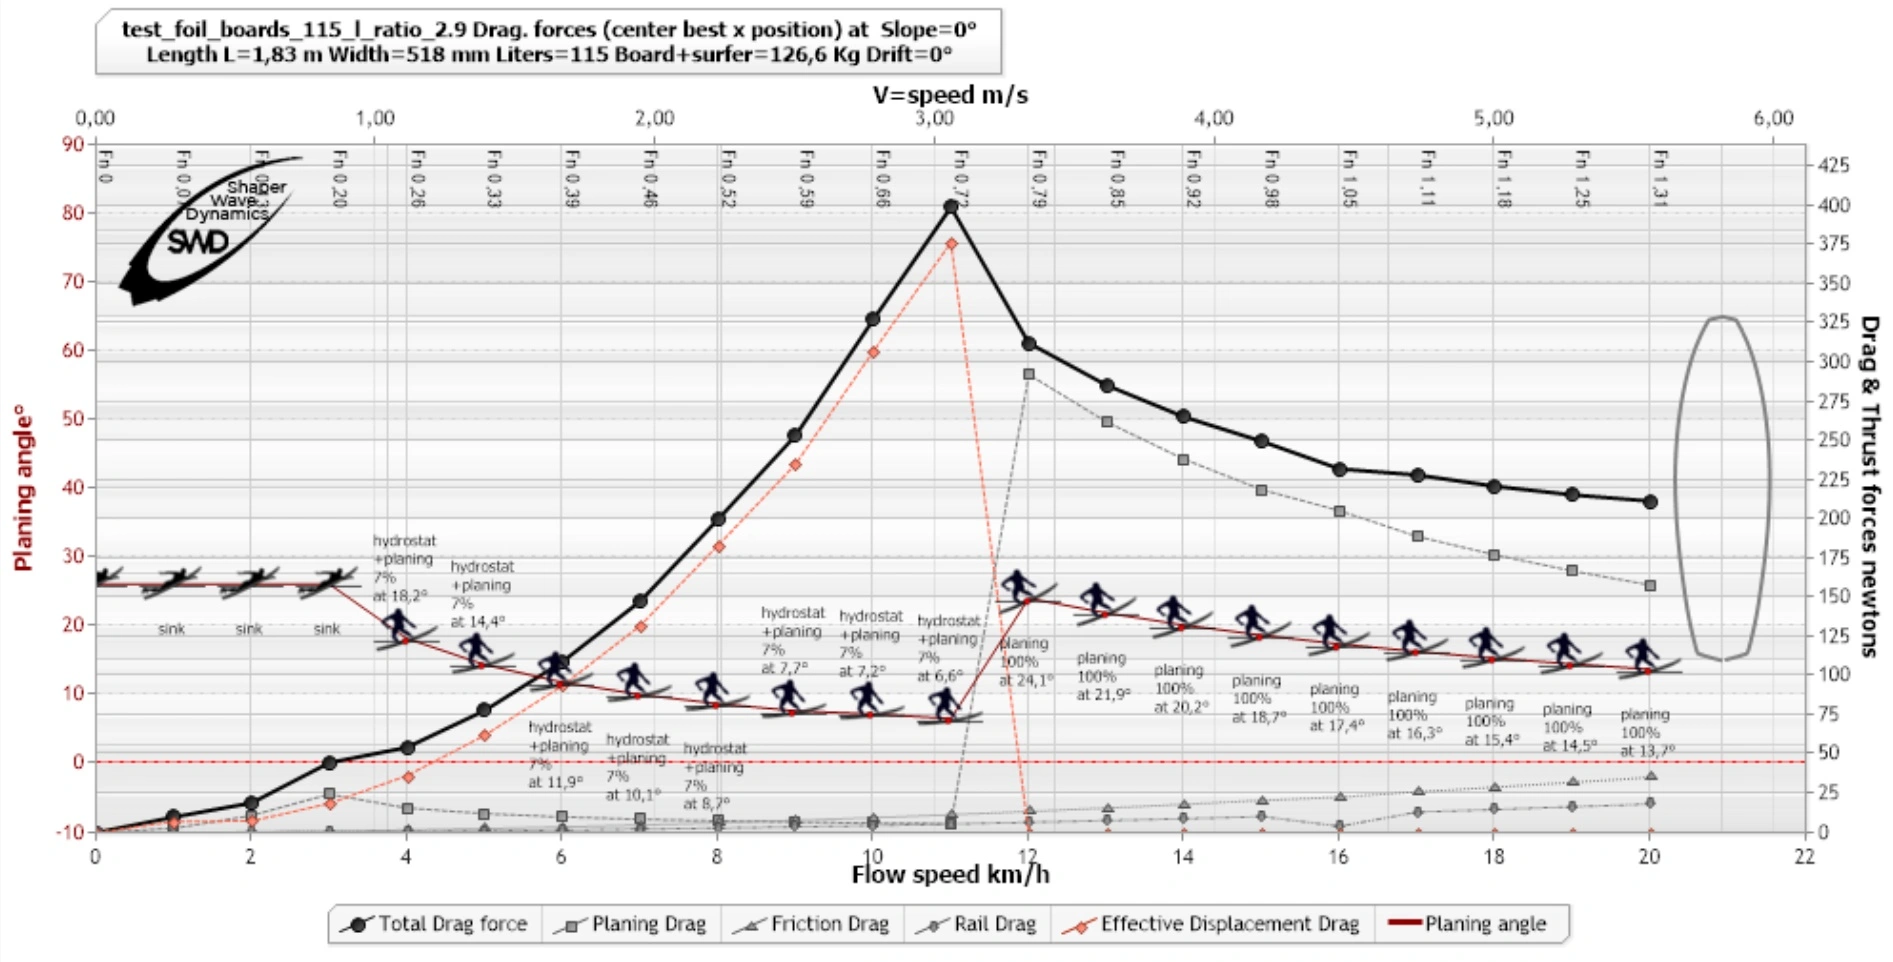
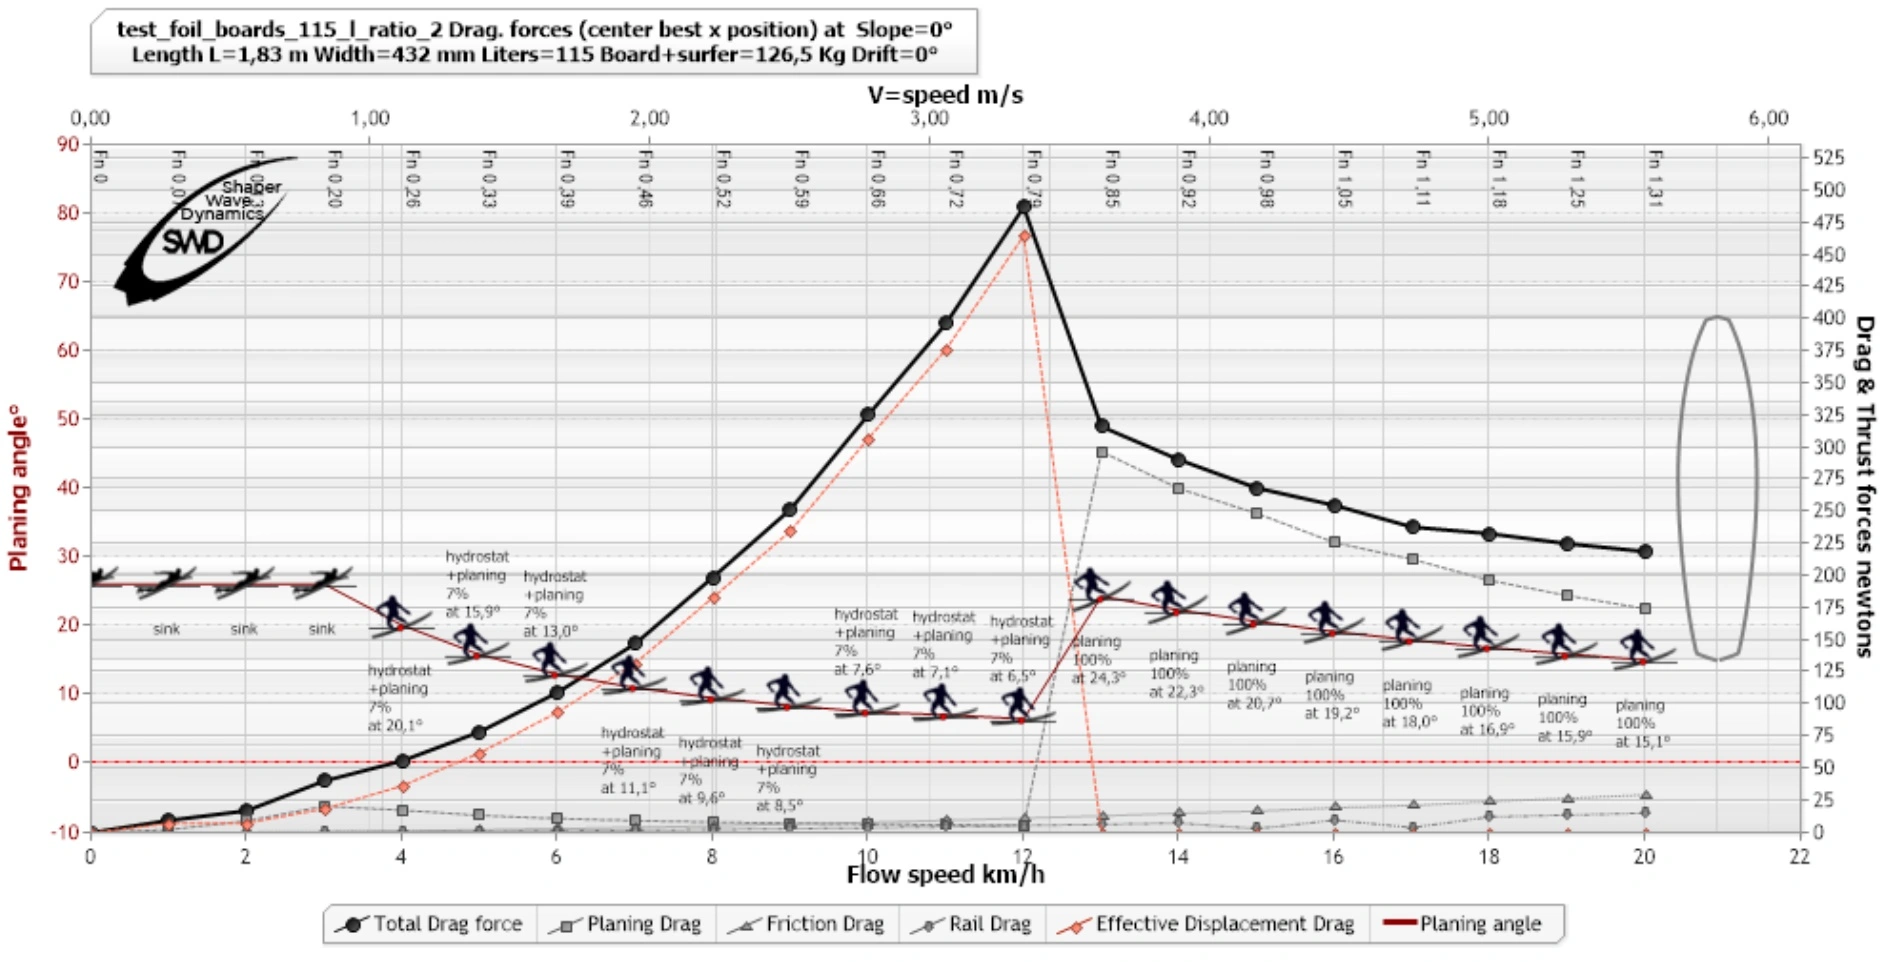
 At the start of the speed ranges, the 120 kg surfer cannot be standing; he will have to reach a speed to create additional lift with planing. The line of incidence is approximately 25 degrees and the silhouette of the surfer in the paddling position indicates "sink", which means that the lift is insufficient, and that the surfer is partially submerged. This range of non-buoyancy ends when the planing input becomes sufficient to carry the surfer. For ratio 4.6, the hydrostatic force + planing lift combination is reached from 3 km/h, for the other ratios it will be necessary to reach 4 km/h. This transitional “water start” phase generates a movement drag relative to the surfer’s weight until reaching planing speed.
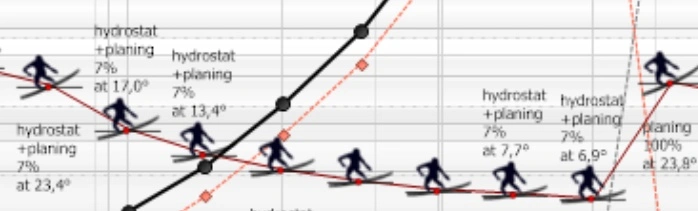
During this phase, the planing angle adjusts to supplement the missing hydrostatic lift, here we see the planing angle providing 7% of the lift, varying from 23.4° up to 6.9°, then switching to planing complete and eliminate movement drag by increasing the angle to 23.8° and producing 100% of the lift necessary to carry the surfer and his board.
- The 4.6 ratio reaches 100% planing at 11 km/h after a peak drag of 325 newtons
- The 2.9 ratio reaches 100% planing at 12 km/h after a drag peak of 400 newtons
- Ratio 2 reaches 100% planing at 13 km/h after a peak drag of 480 newtons. This is, for example, the force that will need to be produced in a wing foil for example to start in water start with these 3 configurations (1 newton equivalent to around 10kg weight).
- The rest of the speed range shows that the 4.6 ratio will remain the least energy-intensive, and will confirm the choice of shaper...